


-
Cart Items5
Continue Shopping-
 SoundSync HeadphonesQty : 2, Color : Ocean Blue
 -
 Western Ladies BagQty : 1, Color : Blush Pink
 -
 Elitr Alarm ClockQty : 2, Color : Sky Blue
 -
 Aus Polo AssnQty : 3, Color : Soft Peach
 -
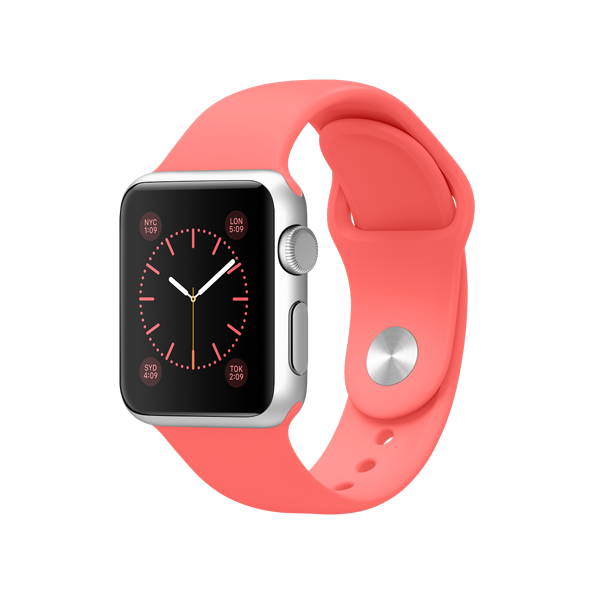 Smart WatchQty : 1, Color : Crimson Red
Total :$740
Your Cart is Empty
Add some items to make it happy :) -
-
 Mr. Jack


SESSIONS DEVICE
Experience a remarkable surge in user engagement over the past week
- MobileIncreased By1.67%Total 1,754
- TabletIncreased By0.46%Total 634
- DesktopDecresed By3.43%Total 878
Browser Statistics
| Browser | Sessions | Bounce Rate |
|---|---|---|
 Google Google,Inc | 1215 | 29.52% |
 Edge Microsoft Corp,Inc | 978 | 24.79% |
 Firefox Mozilla,Inc | 815 | 35.06% |
 Opera Opera,Inc | 1347 | 27.91% |
 Safari Apple Corp,Inc | 1123 | 39.13% |
 Uc Browser Uc Browser,Inc | 1189 | 28.94% |